Frequently Asked Questions
Need additional help? Contact Stellar MLS at support@mfrmls.com or call 800-686-7451.
If you have questions about billing or account information, contact the MarketStats by ShowingTime support center at 800-379-0057 or email us at support@showingtime.com.
How do I access SmartCharts?
SmartCharts offers two service levels, one is free of charge (SmartCharts), the other (SmartCharts Pro) requires a monthly or yearly subscription. To access the free stats available in SmartCharts, users simply need to register with a valid email address and, if a Real Estate Professional, a valid Agent ID and Broker Code. Once you have logged in, you will be redirected to the statistics application on future visits.
What is SmartCharts Pro?
SmartCharts Pro is our premium offering, which has more stats, features and functionality than the free version of the product. SmartCharts Pro offers market gauges, interactive charts, personally branded market reports and more all the way down to the subdivision level.
How do I log in to SmartCharts?
For new users, your user name will be the email address you entered when signing up and the password will be the same as the one you entered during registration. For legacy rbiEXPERT customers, your user name and password credentials will be the same as those you used on rbintel.com, typically your email address by default.
How do I view stats for a different location in my MLS?
Just start typing in any location in the "Change Location" box at the top of the page. The location types you can access depend on your account type. Free users can access (limited) stats and reports for the following location types:
- MLS-wide
- Regional
- County
- ZIP code
SmartCharts Pro users have access to interactive charts, market gauges, Local Market Insight reports, and more for the following location types:
- MLS-wide
- Regional
- County
- City
- ZIP code
- Subdivision
What happens when a ZIP Code straddles multiple cities?
The US Postal Service (USPS) database is used to determine each ZIP Code and its corresponding city name. When a ZIP Code straddles multiple cities, the USPS standard is followed and the default city name is used on the report. However, the data for the entire ZIP Code is in the report regardless of how many city names may refer to the ZIP Code.
Who can see subdivision-level statistics?
All stats for subdivisions are available exclusively for SmartCharts Pro customers. A free, 14-day test drive of SmartCharts Pro is available for all new subscribers. If you cancel before the 14 days are up, your credit card will not be charged.
Why isn’t my subdivision available?
Subdivisions were added based upon a minimum number of sales from 2017 thru 2018. Any subdivision that has fewer than 10 sales over the past two years (averaging less than half a sale per month) was excluded from the product. For statistics to be useful, this minimum was necessary or the reports would just have a bunch of zeroes.
Who can see city-level statistics?
All stats for cities are available exclusively for SmartCharts Pro customers. A free, 14-day test drive of SmartCharts Pro is available for all new subscribers. If you cancel before the 14 days are up, your credit card will not be charged.
I'm used to rbiEXPERT...what's new here?
Since we launched rbiEXPERT a few years ago, there have been a number of common requests and suggestions. We've solved almost every one of them in this next gen product. Highlights:
- New metrics now available, including $/SqFt and Months of Supply.
- Charts have been consolidated into one area, saving clicks (rbiEXPERT had 4 charts, requiring users to rebuild facets when changing to new metrics).
- Facets and metrics will be retained when you change locations (rbiEXPERT users had to rebuild the chart when changing locations).
- Charts let you compare metrics (rbiEXPERT only offered one metric at a time)
- Charts go back 10 years (rbiEXPERT went back 5).
- Charts now have quarterly increments as well as monthly (rbiEXPERT only had monthly)
- Percent Change charts now available. (rbiEXPERT required users to export to Excel to calculate $ or sales appreciation).
- We've optimized the colors in the charts to more clearly differentiate between side-by-side series.
- An "Explore" feature on steroids
- Compare stats for all counties within a region.
- Compare stats for all ZIP codes within a given county or region.
- Export any list to Excel (rbiEXPERT didn't have an Export function in Explore)
How much does a SmartCharts Pro subscription cost?
Less than a tank of gas! We have a low monthly pricing option, no sign-up fees, and no long-term commitments - finally giving real estate professionals access to business-changing statistics without breaking their budget. The monthly subscription costs $19/month.
The annual subscription option is only $159, representing a 30% discount compared to the monthly rate. While this payment would be made upfront, it averages out to just $13.25/month. Whether you sign up for the monthly or annual plan, you will automatically be given a 14-day test drive. Cancel any time during the Test Drive period and no charges will be incurred. If you choose to continue, your credit card will be automatically charged at the end of day 14.
Click here to start your test drive
If it's a 14-day free test drive, why do you need my credit card?
All new subscriptions require a valid credit card be supplied at sign up, though no charges will be incurred at that time. There is no charge until the 14-day trial is over, and you may cancel online prior to the end of the trial period in the "Your Account" section.
I was an rbiEXPERT customer. How do I get into SmartCharts Pro?
Simply log in with your rbiEXPERT user name and password and you're all set. If you've forgotten your rbiEXPERT credentials, enter the email address you have associated with your RBI product on this page and we'll email you a new password.
I can't remember my password, now what?
No problem, just click on the "Login" link at the top right of any page. On the login screen, there is a link to 'Forgot password?' Click on the link to send yourself password information via email.
Don't forget to add rbintel.com to your trusted email sites to ensure you receive the password emails in your inbox.
How am I billed for my SmartCharts Pro subscription?
Billing charges will appear on your credit card as a charge from RealEstate Business Intelligence (RBI). If you need to change your credit card or update the expiration date of your credit card, click on Your Account link in the upper-right hand corner of the screen and click on the link for Billing Information.
Statements are sent to the email address you entered when signing up. Make sure you have trusted rbintel.com to ensure you receive your billing-related emails.
If you have further questions about billing, contact the MarketStats by ShowingTime support center at 800-379-0057 or email us at support@showingtime.com.
If an MLS customer is suspended for non-payment, will their RBI subscription be suspended as well?
Since all SmartCharts service is prepaid, their SmartCharts service will continue until their prepaid period ends, either the end of the current month or the end of their annual subscription. There is no automatic termination of SmartCharts accounts. If their SmartCharts account expires and they try to re-subscribe to SmartCharts after they have been suspended or terminated by Stellar MLS, they no longer appear in the Stellar MLS active agent table, and their re-subscription cannot be completed.
Note: When SmartCharts credit cards are declined due to expiration, decline or closed account, SmartCharts will attempt to collect and notify the customer for a period of 21 days before the customer’s account is automatically converted to the free/basic service. If the customer wishes to re-subscribe anytime thereafter, all they need to do is sign up for a brand new subscription and provide new or updated credit card information.
Where does SmartCharts data come from?
Our data comes directly from the Multiple Listing Service (Stellar MLS).
What stats are available in SmartCharts Pro?
View the "Charts" section on the Stellar MLS-wide location page to get a view all the stats available, and more importantly, check out how easy it is to compare various metrics and drill down by housing characteristics. This will let you play with the actual product interface, but against too wide of an area to be of tremendous use to your business..
Here is the complete list of stats available (see the Definitions page for more information):
Supply and Demand
- Months of Supply
- Contract Ratio
- Absorption Rate (New Pendings)
- Absorption Rate (Closed Sales)
- New Pending to New Listing Ratio
- Seller Success Rate
Market Activity
- Number of Sales
- Number of New Pendings
- Number of All Pendings (end-of-period)
- Number of New Listings
- Number of Active Listings (end-of-period)
Pricing Trends
- Median Sales Price
- Average Sales Price
- Median List Price for Closed Sales
- Average List Price for Closed Sales
- Median List Price for Active Listings (end-of-period)
- Average List Price for Active Listings (end-of-period)
$ per Square Foot
- Average Sold Price per Square Foot
- Average List Price per Square Foot for Active Listings
Pricing Ratios
- Average Sales Price to Original List Price Ratio
Days on Market
- Median Days on Market
- Average Days on Market
When are new data and reports released?
Monthly market activity reports tend to get published between the 12th and 15th of the following month. The data is pulled on the 8th (or the first business day following the 8th) and then there are 4 business days where QC takes place. The publish date is the fifh business day after the pull date.Pulling the data on the 8th allows agents to update their sold listings within the first week after the end of the previous month. Publishing the reports five business days later allows data to be reviewed and cleansed to provide accurate results.
How do I embed a custom chart on my website or blog?
If you want to embed a chart on your site or blog, follow these easy steps:
-
Choose the EMBED option below the chart. You will get a secondary screen with various options.
-
Choose the EMBED TYPE. The auto-update feature will allow you to embed the chart and 'set it and forget it'. Each month, the chart will automatically update with new data if that option is chosen. If you are writing a blog and talking about the data in the chart, that's when you might choose the Fixed Date Range Version instead.
-
Choose the SIZE desired.
-
Copy and paste the HTML code into your website's editor.
-
If desired, add a title or paragraph explaining the chart for your customers.
You're all set! Your customers will now have access to the chart you chose. Here's an example:
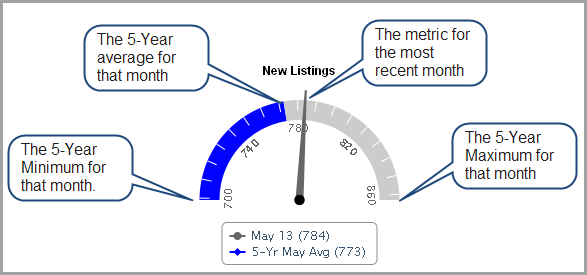
How do I interpret the dashboard gauges?
Each gauge on the dashboard provides critical info about a key metric for the location selected. It provides a single view of the indicator for the most recent month and how it compares with the 5-year minimum for that month, the 5-year maximum for that month and the 5-year average for that month. Due to the seasonal nature of real estate statistics, the ability to compare stats vs. the same period in the past is a great way to gauge market health.
The following graphic should help you understand the key points of our gauges: